
Research Experience for Teachers (2015-2016)
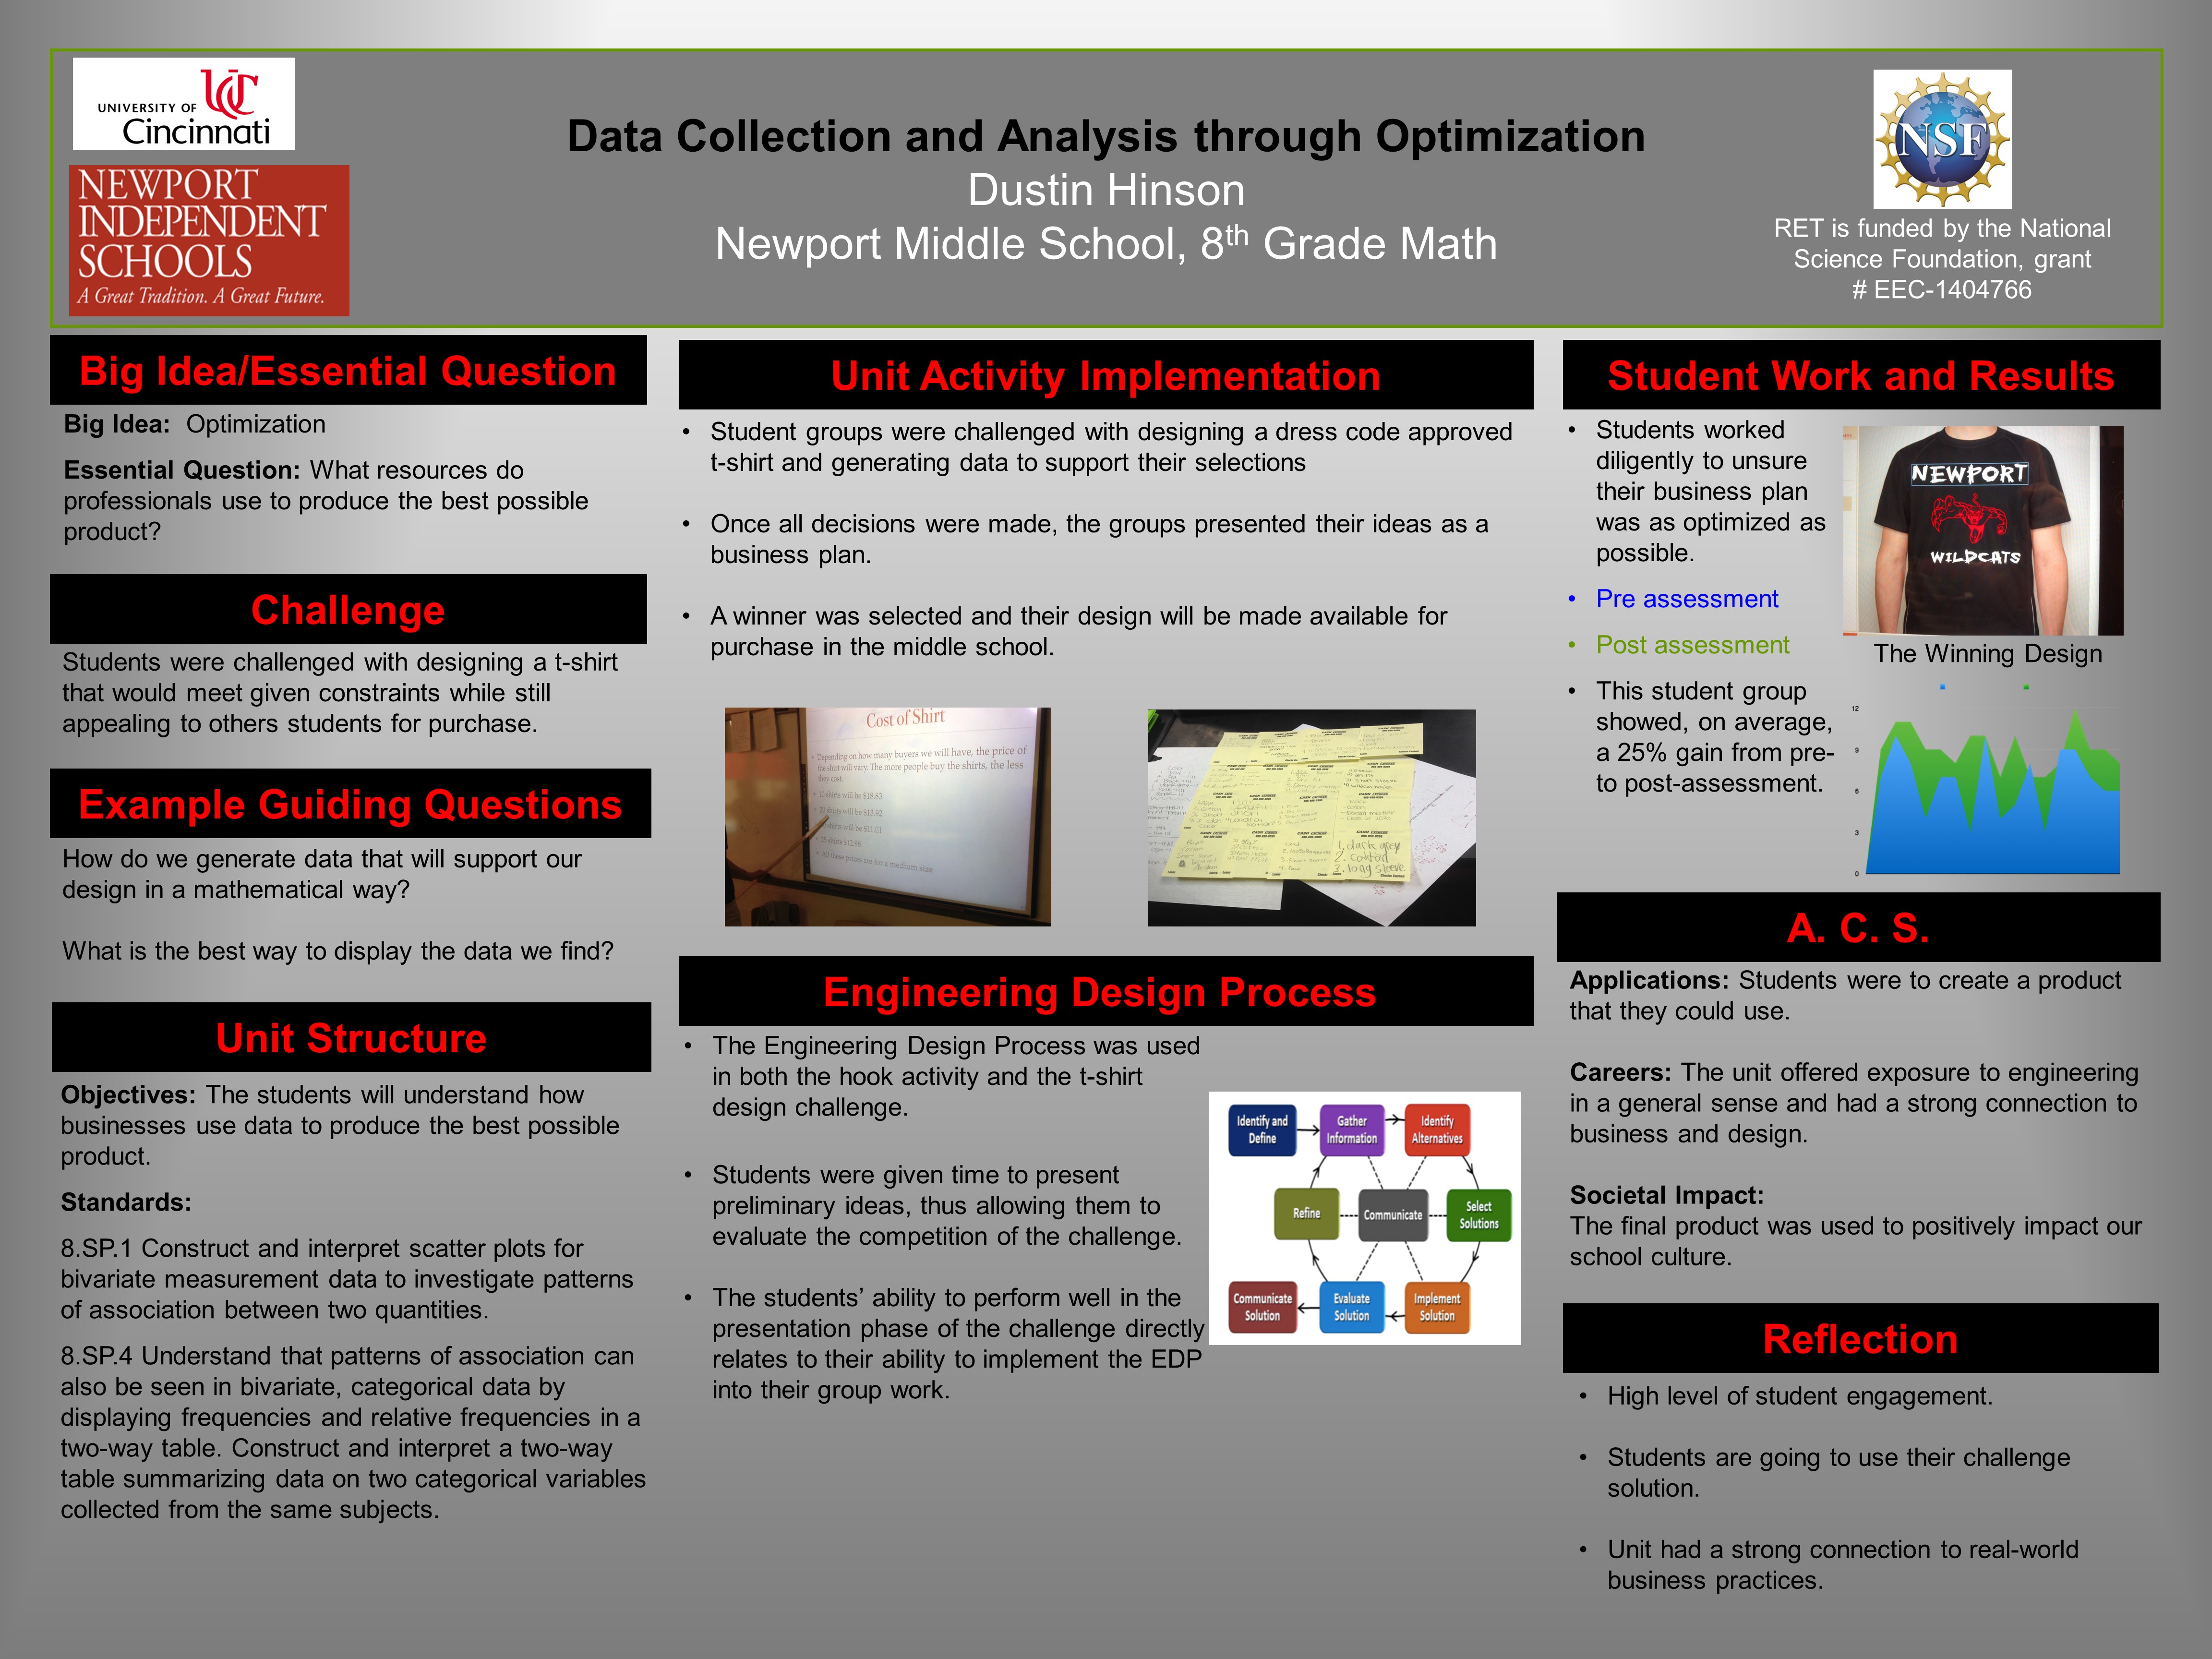
Data Collection and Analysis through Optimization
 |
||||||
|
||||||
|
The Big Idea (including global relevance) The unit focus is optimization, which is applying mathematics to find the best possible solution to a problem. The instruction will be taught under the umbrella of a Data Analysis unit. Building scatter plots and comparing data for the purpose for analyzing relationships with in two different data sets is a large part of 8th grade mathematics. The students will be learning and working through an understanding of basic business practices. At the conclusion of the unit, the students will need to understand that basic optimization is essential in all business formats and that mathematics drive most business decisions. Their ability to solve math problems will be extremely important to them in their careers. |
|
Essential Questions
|
|
The Hook
Students will be given a predetermined amount of money that they will then use to buy materials to construct their object that will protect a golf ball size object. They will later find out that the object is an egg. The students will begin by building a basic understand of an optimization problem. Often in life and business materials are not infinitely accessible, and the most successful businesses find ways to maximize profits by using materials in an optimum way. The teacher will use the challenge as a way to foster a classroom discussion about general optimization. |
|
The Challenge The challenge will call students to design a t-shirt that can be sold as the official 8th grade t-shirt. The challenge will be to collect data that guides the design process toward an end product that is both cost efficient and appealing to the students. A winning design will be printed at the high school print shop and sold at the middle school as spirit wear. |
|
Guiding Questions
|
ACS (Real world applications; career connections; societal impact)
The students are looking at a problem that exist in most businesses. Find the best possible product while balancing demand and cost efficiency. I believe this to be a basic strategy for every business. On one level or another, all of my students will be expected to do this at some point during their working life.
I believe the project to have significant social impact do to the fact that many students will be wearing the shirt on the regular basis. The product does not contain the element of greatly improving the world around us. Students are not trying to make the world a better place, however they are developing an ethical business model that will produce a desired outcome.
All business professions; Engineering mainly of the mechanical and structural types.
Misconceptions
- Students are likely to come to school with misgivings about what it takes to produce a product that people actually want to buy. The research and development that most businesses apply to everyday products is probably not understood by most of my students.
- I expect students to struggle with developing sufficient data to support their design. I will be encouraging them through brainstorming activities and modeling effective data analysis tools during instruction after the hook.
Unit Lessons and Activities
- Lesson 1: This three-day lesson will be used to get the students started to think about optimization. The students will participate in the hook, which is part optimization problem, brainstorm ideas for what we could “optimize”, and start to work on building appropriate data displays.
- Activity 1: The big “why” in data collection. (One day)
- Activity 2: The big “why” in data collection. (Two days)
- Lesson 2: In this five day lesson students will finish learning about data displays and participate in the challenge of building a t-shirt. The unit culminates with the students presenting a well-supported business plan encompassing many CBL and EDP aspects that have been spiraled in throughout the unit.
- Activity 3: Devising an Optimized Business Plan (Two days)
- Activity 4: Devising an Optimized Business Plan (Three days)
- Evidence of CBL: L1A1, L2A2
- Evidence of EDP: L1A1, L1A2, L2A3, L2A4
Additional Resources
Materials for egg drop; Data analysis word problems; Materials for t-shirt design;
Formal list of constraints from high school printing department; Pricing information from school printing department.